


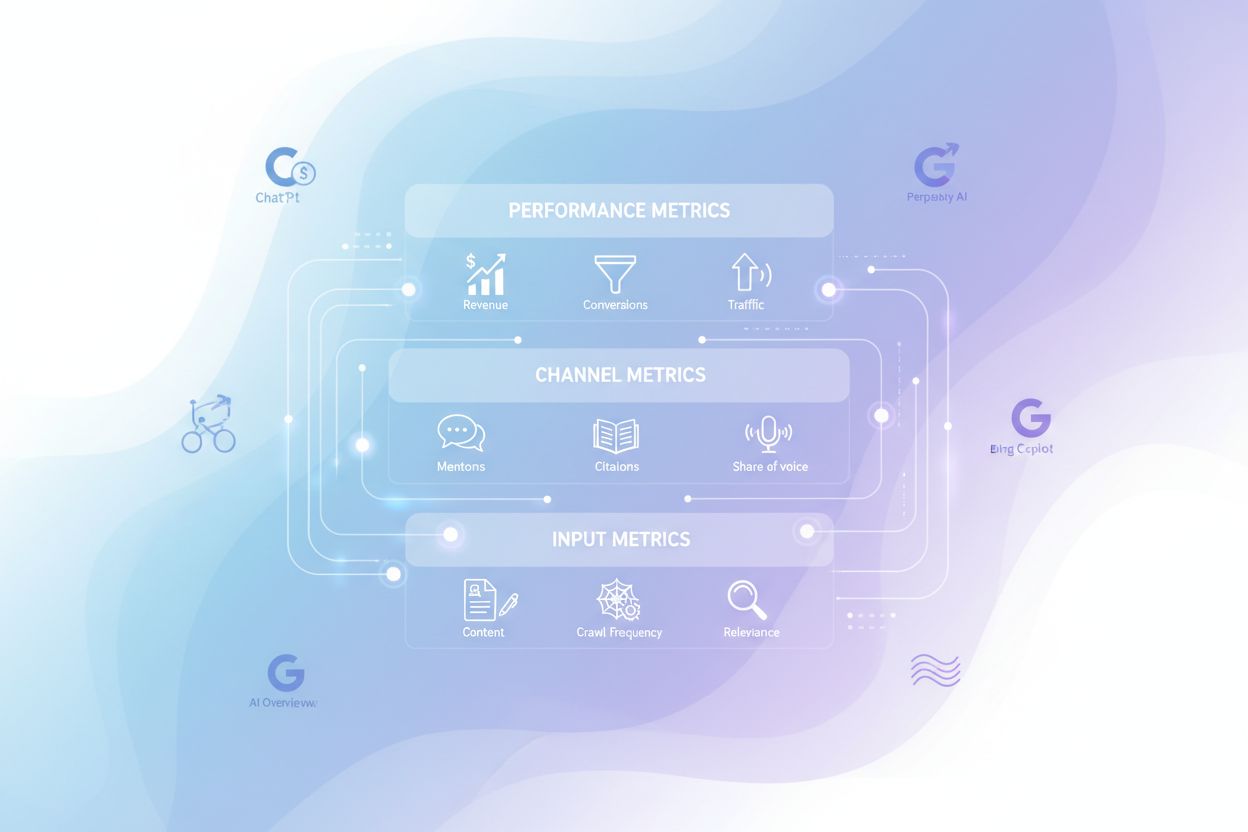
Creating an AI Visibility Measurement Framework
Learn how to build a comprehensive AI visibility measurement framework to track brand mentions across ChatGPT, Google AI Overviews, and Perplexity. Discover key...
10 min read
A practical framework for measuring AI search visibility: the four layers of measurement, how to calculate citation rate, visibility score, and share of voice, and how to track AI referral traffic in GA4.
For years, search marketing success was simple: rank higher, get more clicks, drive more traffic. Google Search Console showed your rankings. Google Analytics tracked your sessions. The formula was linear and measurable.
Then AI search changed everything.
Today, ChatGPT, Perplexity, Google AI Overviews, Gemini, Claude, and other large language models (LLMs) are answering user questions directly, without users ever clicking through to your website. Your brand can be mentioned in 1,000 AI responses, shape purchasing decisions, and drive awareness, yet GA4 shows zero sessions. Your content can be cited as authoritative, yet appear nowhere in traditional search rankings.
This is the AI search visibility paradox: Your influence is growing while your traditional metrics stay flat.
How to measure AI search visibility metrics and KPIs is no longer optional for brands serious about staying visible in 2026 and beyond. This guide shows you exactly how to track presence in AI-generated answers, connect that visibility to business outcomes, and build a sustainable measurement framework that works alongside traditional SEO, not instead of it.
By the end of this guide, you’ll understand:
Difficulty: Intermediate | Time to Read: 15–20 minutes | Time to Implement: 2–4 weeks
Before you start measuring AI search visibility, gather these essentials:
| Tool / Resource | Purpose | Required? |
|---|---|---|
| Google Analytics 4 (GA4) | Track AI referral traffic and conversions | Yes |
| Access to AI Platforms | Manual prompt testing (ChatGPT, Perplexity, Gemini, Claude) | Yes |
| SEMrush or Ahrefs | Track AI citations across platforms | Recommended |
| Server Log Access | Monitor LLM crawler activity (GPTBot, ClaudeBot, etc.) | Optional |
| Foglift, Peec AI, or Cairrot | Automate AI visibility monitoring | Optional |
| Google Search Console | Monitor AI Overviews impact on traditional search | Recommended |
| Spreadsheet or BI Tool | Dashboard and reporting | Yes |
If you don’t have access to premium tools, don’t worry: this guide includes manual methods to measure AI visibility using only GA4, Google Search Console, and direct prompt testing.
AI search visibility isn’t a single metric. It’s a layered system where each layer answers a different question:
| Layer | Question | Key Metrics | Business Value |
|---|---|---|---|
| Layer 1: Visibility | Are you appearing in AI responses? | AI Visibility Score, Citation Rate, Mention Rate | Brand awareness, category authority |
| Layer 2: Quality | How are you appearing (accurately, positively)? | Sentiment Score, Entity Accuracy, Recommendation Rank | Brand reputation, trust |
| Layer 3: Engagement | Are users interacting with your content? | AI Referral Traffic, Engagement Rate, Bounce Rate | Site visits, user behavior |
| Layer 4: Business Impact | Is AI visibility driving revenue? | Conversions, Pipeline Influence, Revenue Attribution | ROI, budget justification |
Most teams focus only on Layer 1 (visibility). The complete picture requires all four.
You can’t measure what you don’t monitor. The first step is defining a fixed set of 20–500 prompts that represent your business, category, and customer journey.
Identify your core categories:
Segment by funnel stage:
Example prompt set for a CRM company:
1. What is a CRM?
2. Best CRM for small business
3. Best CRM for startups
4. HubSpot vs Salesforce
5. HubSpot vs Zoho
6. Best CRM for customer service
7. Best CRM for sales teams
8. Best CRM pricing
9. CRM implementation best practices
10. How to choose a CRM
... (20–50 total)
Pro Tip: Refresh your prompt set quarterly as your category evolves and new competitors emerge.
Before you optimize, you need to know where you stand. Run your prompt set across all major AI platforms and record these initial metrics:
Document these in a spreadsheet. This becomes your benchmark for measuring quarterly growth.
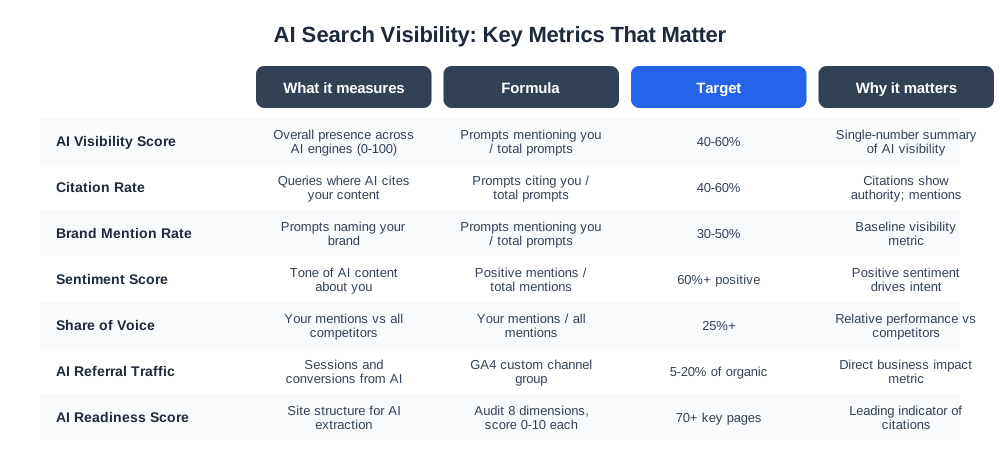
AI Visibility Score is the single most important KPI. It’s a 0–100 composite score representing your overall presence across AI engines.
AI Visibility Score = (Prompts mentioning your brand / Total prompts monitored) × 100
This single number tells your leadership whether your AI strategy is working. Aim for 10% quarterly growth as a realistic improvement target.
Citation Rate is different from visibility. A mention is when AI says your name. A citation is when AI uses your content as a source.
Example:
Citation Rate = (Prompts citing your content / Total prompts monitored) × 100
Run each prompt and note whether AI:
Count citations only (not just mentions)
Calculate the percentage
Important: Citation rates vary dramatically by AI engine. ChatGPT may cite you 30% of the time; Perplexity may cite you 50% of the time. Always track by platform.
Your brand can appear in AI responses positively or negatively. Sentiment Score measures the tone.
| Sentiment | Example | Impact |
|---|---|---|
| Positive | “One of the most trusted CRM platforms with excellent customer support” | Increases trust and intent |
| Neutral | “HubSpot is a CRM platform used by many businesses” | Informational; doesn’t drive preference |
| Negative | “HubSpot has higher pricing than competitors” | May reduce intent or position you as premium |
Unlike traditional SEO, AI platforms don’t always pass referrer data. But you can still track AI traffic by setting up a custom channel group.
Step 1: Go to Admin → Custom Channel Groups
Step 2: Clone the “Default Channel Group”
Step 3: Create a new channel called “AI Traffic”
Step 4: Add this regex rule:
(chatgpt|openai|anthropic|deepseek|grok)\.com|(gemini|bard)\.google\.com|(perplexity|claude)\.ai|(copilot\.microsoft|edgeservices\.bing)\.com|edge\scopilot
Step 5: Save and reorder so “AI Traffic” appears near “Organic Search”
Once activated, your GA4 dashboard will show:
Share of Voice answers: “Of all the brand mentions in AI responses, what percentage are mine?”
AI SOV = (Your mentions / Total competitor + your mentions) × 100
In 50 prompts about “best CRM software,” you count:
Your AI SOV = (18 ÷ 67) × 100 = 27%
Pro Tip: SOV often matters more than absolute visibility. You can have a 50% visibility score but only 20% SOV if competitors are also appearing frequently.
Before AI engines cite you, they must crawl you. LLM crawler monitoring is an early indicator of future visibility.
| Crawler | Engine | User-Agent |
|---|---|---|
| GPTBot | ChatGPT / OpenAI | GPTBot/1.0 |
| ClaudeBot | Claude / Anthropic | ClaudeBot/1.0 |
| PerplexityBot | Perplexity | PerplexityBot/1.0 |
| Gemini-Crawler | Google Gemini | Gemini-Crawler/1.0 |
| Google-Extended | Google AI Overviews | Google-Extended/1.0 |
Option 1: Server Log Analysis (Most Accurate)
Option 2: Free WordPress Plugin (Easiest)
Install Cairrot’s WordPress LLM Crawler Logger (free):
Option 3: Manual Monitoring (GA4)
Add a filter to GA4 to segment bot traffic:
User-Agent contains GPTBot OR ClaudeBot OR PerplexityBotAI Readiness Score measures how well your website is structured for AI engines to extract and cite your content. This is a leading indicator: pages with high AI Readiness typically see higher citations within 2–4 weeks.
| Dimension | What It Measures | Example |
|---|---|---|
| Structured Data | Schema markup (FAQ, HowTo, Article) | <script type="application/ld+json"> tags |
| Heading Clarity | H1, H2, H3 hierarchy | Clear, descriptive headings |
| FAQ Quality | FAQ schema and Q&A format | Matching user intent questions |
| Entity Identity | Clear company/product definitions | About page, schema markup |
| Content Depth | Comprehensive coverage of topics | 2,000+ words on key topics |
| Answer Formatting | Direct, scannable answers | Bullet points, tables, bold text |
| Topical Authority | Cluster of related content | Pillar + cluster articles |
| AI Crawler Access | robots.txt allows AI bots | Explicit allow rules for GPTBot, etc. |
For each page, score 0–10 on each dimension:
AI Readiness Score = (Total points / 80) × 100
Target: 70+ on key landing pages; 85+ on cornerstone content.
The highest-level KPI: Does AI visibility drive revenue?
Traditional attribution models (last-click, multi-touch) don’t work for AI because:
When AI mentions your brand, high-intent users search for you directly.
Interpretation: A 20% lift in branded searches often correlates with 30–50% increase in AI citations.
Some users skip Google and go directly to your site after seeing you in AI.
For B2B or high-value products:
Example: If AI traffic is 1,000 sessions/month and incrementality testing shows 3% lift, that’s 30 incremental conversions/month.
| Metric | Value | Calculation |
|---|---|---|
| AI Sessions/Month | 500 | From GA4 |
| Branded Search Lift % | 25% | Month-over-month |
| Incremental Branded Searches | 125 | 500 × 25% |
| Branded Search Conv. Rate | 15% | From GSC + GA4 |
| Incremental Conversions | 19 | 125 × 15% |
| Avg. Customer Value | $5,000 | Your data |
| Incremental Revenue | $93,750 | 19 × $5,000 |
Reporting brings data to life. A good dashboard shows trends, not just numbers.
┌─────────────────────────────────────────────────────┐
│            AI VISIBILITY DASHBOARD                  │
├─────────────────────────────────────────────────────┤
│  AI Visibility Score: 42% (↑ 5% from last month)   │
│  Citation Rate: 28% (↑ 3% from last month)         │
│  Share of Voice: 31% (↑ 2% from last month)        │
│  Sentiment Score: 72% (stable)                     │
├─────────────────────────────────────────────────────┤
│  AI Referral Traffic: 342 sessions (↑ 18%)         │
│  AI Conversions: 12 (↑ 25%)                        │
│  Branded Search Lift: +15% (↑ 8%)                  │
├─────────────────────────────────────────────────────┤
│  Platform Breakdown:                                │
│    ChatGPT: 35% visibility, 32% citation           │
│    Perplexity: 48% visibility, 35% citation        │
│    Gemini: 42% visibility, 25% citation            │
│    Claude: 38% visibility, 28% citation            │
├─────────────────────────────────────────────────────┤
│  Top Cited Pages:                                   │
│    1. /pricing (42 citations)                       │
│    2. /features (38 citations)                      │
│    3. /case-studies (31 citations)                  │
└─────────────────────────────────────────────────────┘
Consistency matters. Here’s the recommended schedule:
| Frequency | Task | Owner | Tools |
|---|---|---|---|
| Daily | Monitor crawler activity | SEO/Tech team | Server logs or Cairrot |
| Weekly | Run prompt set; track mentions | Marketing/SEO | Manual testing + spreadsheet |
| Weekly | Review GA4 AI traffic | Analytics team | GA4 |
| Monthly | Calculate KPIs (visibility, citation rate, SOV) | SEO lead | Spreadsheet or Foglift |
| Monthly | Sentiment analysis | Content/Brand team | Manual or Foglift |
| Monthly | Dashboard update & reporting | SEO lead | GA4 + custom dashboard |
| Quarterly | Competitive benchmarking | SEO lead | Ahrefs/SEMrush AI tools |
| Quarterly | Strategy review & optimization | Leadership | Dashboard + recommendations |
Best for: AI referral traffic, conversions, engagement
Best for: AI Overviews impact on traditional search
Best for: The most direct way to automate everything in this guide
Best for: Citation tracking, competitive benchmarking
Best for: Citation analysis, source tracking
Best for: Comprehensive AI visibility measurement
Best for: Revenue-focused AI visibility
Best for: LLM crawler tracking
Best for: Budget-conscious teams
Cause: AI platforms don’t pass referrer data reliably; citations happen without clicks.
Solutions:
Cause: AI responses are probabilistic; the same prompt produces different answers.
Solutions:
Cause: Google mixes AI Overviews into organic traffic in GA4.
Solutions:
Cause: robots.txt is blocking AI crawlers, or your site isn’t indexed.
Solutions:
Check robots.txt for these rules:
User-agent: GPTBot
Disallow: /
If present, remove or allow specific paths.
Add explicit allow rules:
User-agent: GPTBot
Allow: /

User-agent: ClaudeBot
Allow: /

User-agent: PerplexityBot
Allow: /
Verify site indexing in Google Search Console
Check for noindex tags on important pages
Cause: No automated sentiment analysis for AI responses.
Solutions:
Cause: Not tracking which URLs AI cites.
Solutions:
Cause: Last-click attribution doesn’t capture AI’s influence.
Solutions:
Executives care about one thing: ROI. Here’s how to frame your AI visibility metrics for buy-in.
Tell this story:
“Our AI visibility is growing. Last month, we appeared in 42% of relevant AI responses (up from 35% three months ago). That visibility drove an estimated $94,000 in incremental revenue through branded search lift and direct conversions. We’re investing in [specific optimization] to reach 50% visibility by Q3, which should drive $150,000+ in incremental revenue.”
The three metrics:
QUARTERLY AI VISIBILITY REPORT
═══════════════════════════════════════════════════════════════

AI VISIBILITY SCORE: 42% (↑ 7 points from Q1) ✓ ON TRACK
├─ Target: 50% by Q3 2026
├─ Growth rate: 2.3% per month (need 2.7% to hit target)

CITATION RATE: 28% (↑ 4 points from Q1) ✓ ON TRACK
├─ Competitors average: 24%
├─ Our advantage: +4 points

SHARE OF VOICE: 31% (↑ 2 points from Q1) ✓ GAINING GROUND
├─ Competitor A: 35% (↓ 1 point)
├─ Competitor B: 22% (↓ 2 points)

INCREMENTAL REVENUE: $94,000 (↑ 32% from Q1)
├─ AI referral traffic: $42,000
├─ Branded search lift: $52,000
├─ ROI on AI optimization spend: 340%

RECOMMENDED NEXT STEPS:
✓ Double down on high-citation content (pricing, features pages)
✓ Expand FAQ schema on 50 additional pages
✓ Launch GEO optimization campaign for top 10 prompts
Once you’re measuring, optimization follows. Here are the fastest wins:
Arshia is an AI Workflow Engineer at FlowHunt. With a background in computer science and a passion for AI, he specializes in creating efficient workflows that integrate AI tools into everyday tasks, enhancing productivity and creativity.

Am I Cited tracks citation rate, mention rate, sentiment, and share of voice across ChatGPT, Perplexity, and Google AI Overview automatically, so you're not testing prompts by hand every week.
Learn how to build a comprehensive AI visibility measurement framework to track brand mentions across ChatGPT, Google AI Overviews, and Perplexity. Discover key...
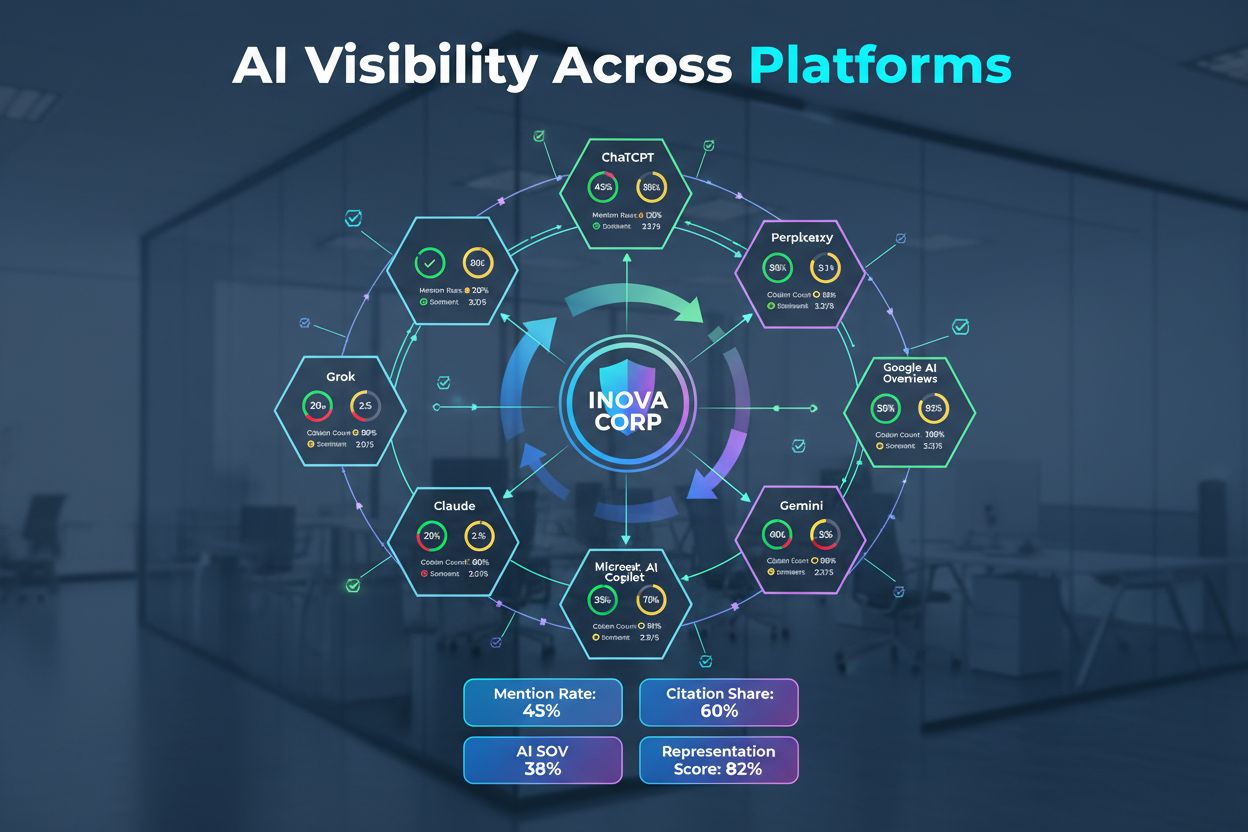
Discover the essential AI visibility metrics and KPIs to monitor your brand's presence across ChatGPT, Perplexity, Google AI Overviews, and other AI platforms. ...

Learn how to define and measure AI visibility KPIs. Complete framework for tracking mention rate, representation accuracy, citation share, and competitive voice...
Cookie Consent
We use cookies to enhance your browsing experience and analyze our traffic. See our privacy policy.